

“We have been a FirstWatch customer for the past year and have been continuously impressed with their ability to help us maximize our responses and create efficiencies within our service.
In addition to the analytic tools, we have been able to create special hazard and paramedic safety notifications that help us improve the safety of our paramedics and responders. As COVID-19 began to emerge we instinctively turned to FirstWatch to help us design an alert that would help us increase the safety of paramedics.
FirstWatch was able to work with us to design a custom alert that immediately notifies supervisors when paramedics are responding to a call that could result in a potential exposure.
We have found this trigger to be effective and immediate. We have had several recent instances in which this FirstWatch trigger was able to alert our supervisors of a potential COVID-19 exposure BEFORE the paramedics arrived on scene. The supervisors were able to communicate this information to the crews, augmenting their protection and reducing their chance of exposure.
We are incredibly thankful for this alert system and for the dedication of the FirstWatch team.”

![]() -Adam Bennett BA AEMCA ASM, Commander (A), Middlesex-London Paramedic Service
-Adam Bennett BA AEMCA ASM, Commander (A), Middlesex-London Paramedic Service
“Thank you for all you do to support us. Our COVID-19 trigger makes our oversight job just that much easier. And with the world today that is much appreciated. Stay safe.”

![]() -Jon Kelley Trinity EMS Metro Boston, MA
-Jon Kelley Trinity EMS Metro Boston, MA
“You guys have been truly amazing during this crisis and I mean that from the bottom of my heart. I honestly cannot imagine what we would be doing right now if we didn’t have FirstWatch…”

![]() -Kurt Mills Sno911 Snohomish County, WA
-Kurt Mills Sno911 Snohomish County, WA
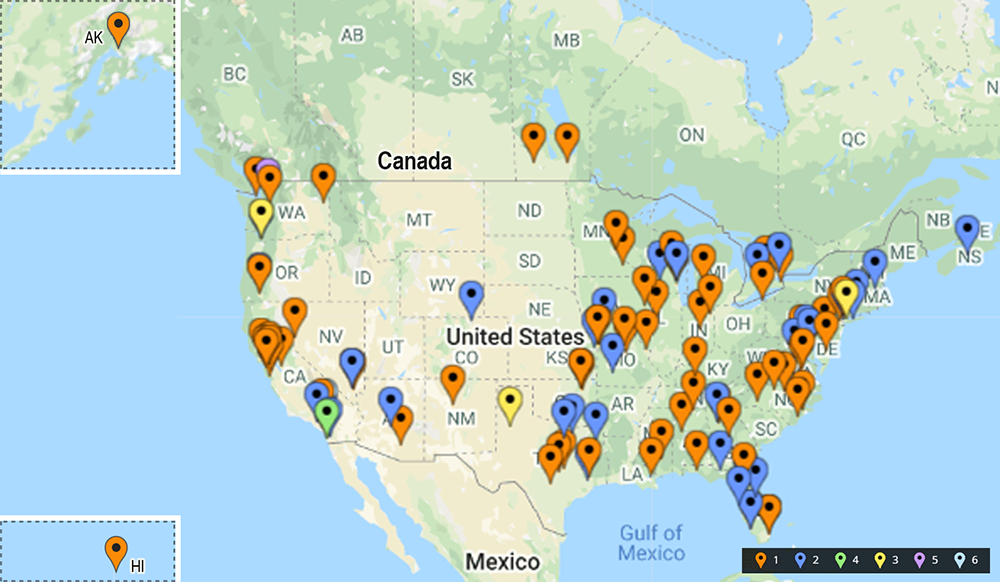
For over 21 years FirstWatch has provided real-time, automated data visualizations & alerts for our customer partners across the US & Canada…everyday, as well as during H1N1, MERS, Ebola, and now COVID-19.
The proven combination of user-defined FirstWatch data filter criteria (Triggers), via real-time interfaces into Computer-Aided Dispatch (CAD), ProQA for EMD, along with ePCR data mash-ups are designed to offer Dashboards, Reports and other data visualizations displayed on Maps, Charts and Graphs. Additionally, we recently also enabled automated FirstWatch data feeds into tools like MS PowerBI, which offers enhanced views that benefit of EMS, Fire, Law, Public Health, 9-1-1 and Emergency Management teams…all in real-time, automatically.
FirstWatch Trigger and Report views against COVID-19 criteria is now also enhanced via our new PowerBI (PBI) COVID-19 Dashboard. Our goal is to provide customers with easily understandable and ‘quick glances’ of COVID-19 criteria displayed as FirstWatch Triggers, Reports also via the PBI dashboard too! All of the FirstWatch data visualization tools are designed to Help the Helpers quickly & easily understand how the COVID-19 pandemic is affecting their emergency service teams and citizens they serve.
The new COVID-19 Dashboard view enables users with the ability to filter data by date and location, as well as the impacts on various facilities, patient impressions recorded and locations of calls within a community. This is accomplished through several visual displays on two, easy to use and intuitive pages. All of the tables and graphs can be exported to an appropriate file format and the underlying data can be viewed by a single mouse click on an options selection in each presentation.
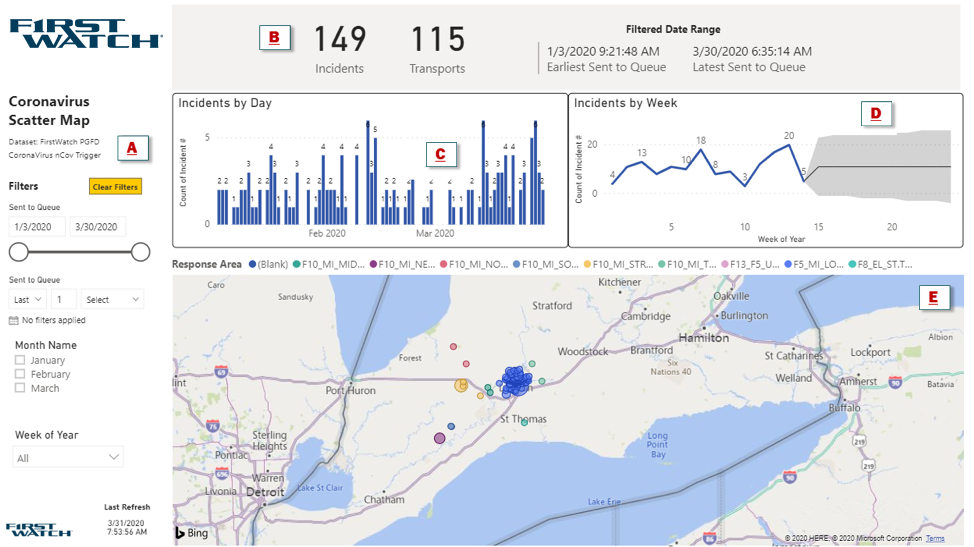
A – Time Slicer: The dashboard is equipped with filtering capabilities that allow each user to select a surveillance period. When filters are applied, all the data on the page (including the map data) are changed to reflect the specific time period selected.
B – Transport And Incident Summary: Summary of the number of incidents meeting the dispatch criteria for COVID-19 identification as well as the number of transports resulting from these requests for service.
C and D – Incidents By Day/incidents By Week: Provides a time series of incidents meeting the criteria for COVID-19 suspicion. Selecting an individual day or week will change the map view to indicate the call locations for that specific day as well as changing the Transport and Incident Summary to the totals for the time period selected. The Incidents by Week view is provided with a Cone of Uncertainty that provides a Smoothed Exponential view of projected trajectory and degree of variance from the mean of future calls.
E – Map: The map provides a geo-spatial representation of the calls for service that are selected either through the date slicer (A) or the individual days or weeks selected (C). The map scale is fully adjustable by utilize your mouse’ scroll bar. Hovering over it provides information on a specific call or information on a cluster of calls for service if applicable. Specific address information may optionally be provided in a hover function if appropriate authority is granted.
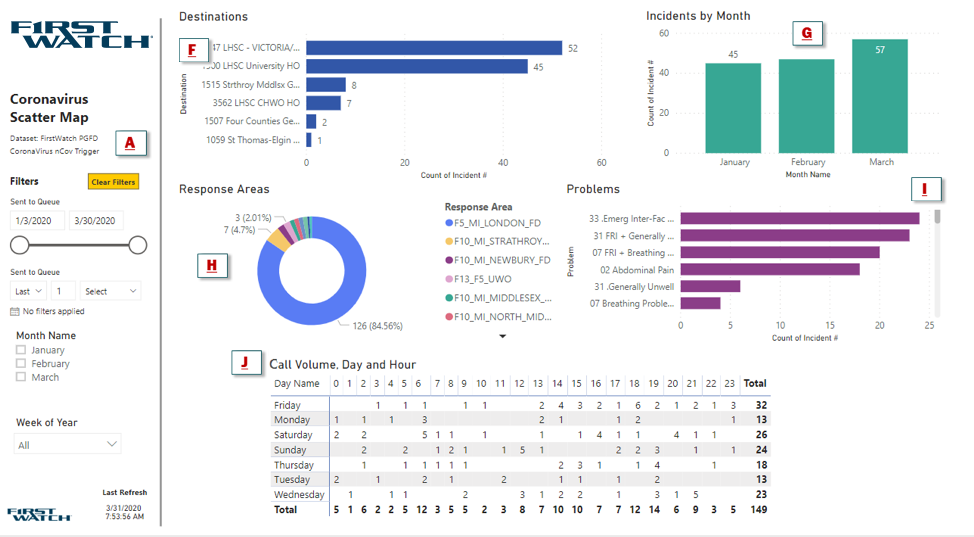
F – Destinations: Provides a quick glance view of what facilities have received what number of COVID-19 suspected cases. Again, a time slicer is provided to allow selection of any date or date range desired. Selection of any individual facility will change the other displays on the page to reflect the totals for the individual facility selected, thus providing a view into Chief Complaints/Problems, Response Areas, Demand by hour of day and day of week and Incidents by month for that specific facility.
G – Incidents By Month: Provides a running summary of COVID-19 suspected calls by month. Again, selection of any individual month will provide reporting from the other dimensions on this page for the month selected.
H – Response Areas: This provides a quick view and ability to sort data based upon the community or response area defined in the data.
I – Problems: The problems/chief complaints provided at call intake are summarized in a Pareto type format for easy identification of emerging trends in potential disease presentation. The top six problem types are displayed with the ability to scroll down through the entire list as needed.
J – Call Volume Day And Hour: Presents a standard ‘heat map’ type display indicated the hour of day and day of week COVID-19 identified cases are received. This can be used to assist in deployment decisions and overall system design parameters. The table also changes its display based upon the filter criteria selected on the page.
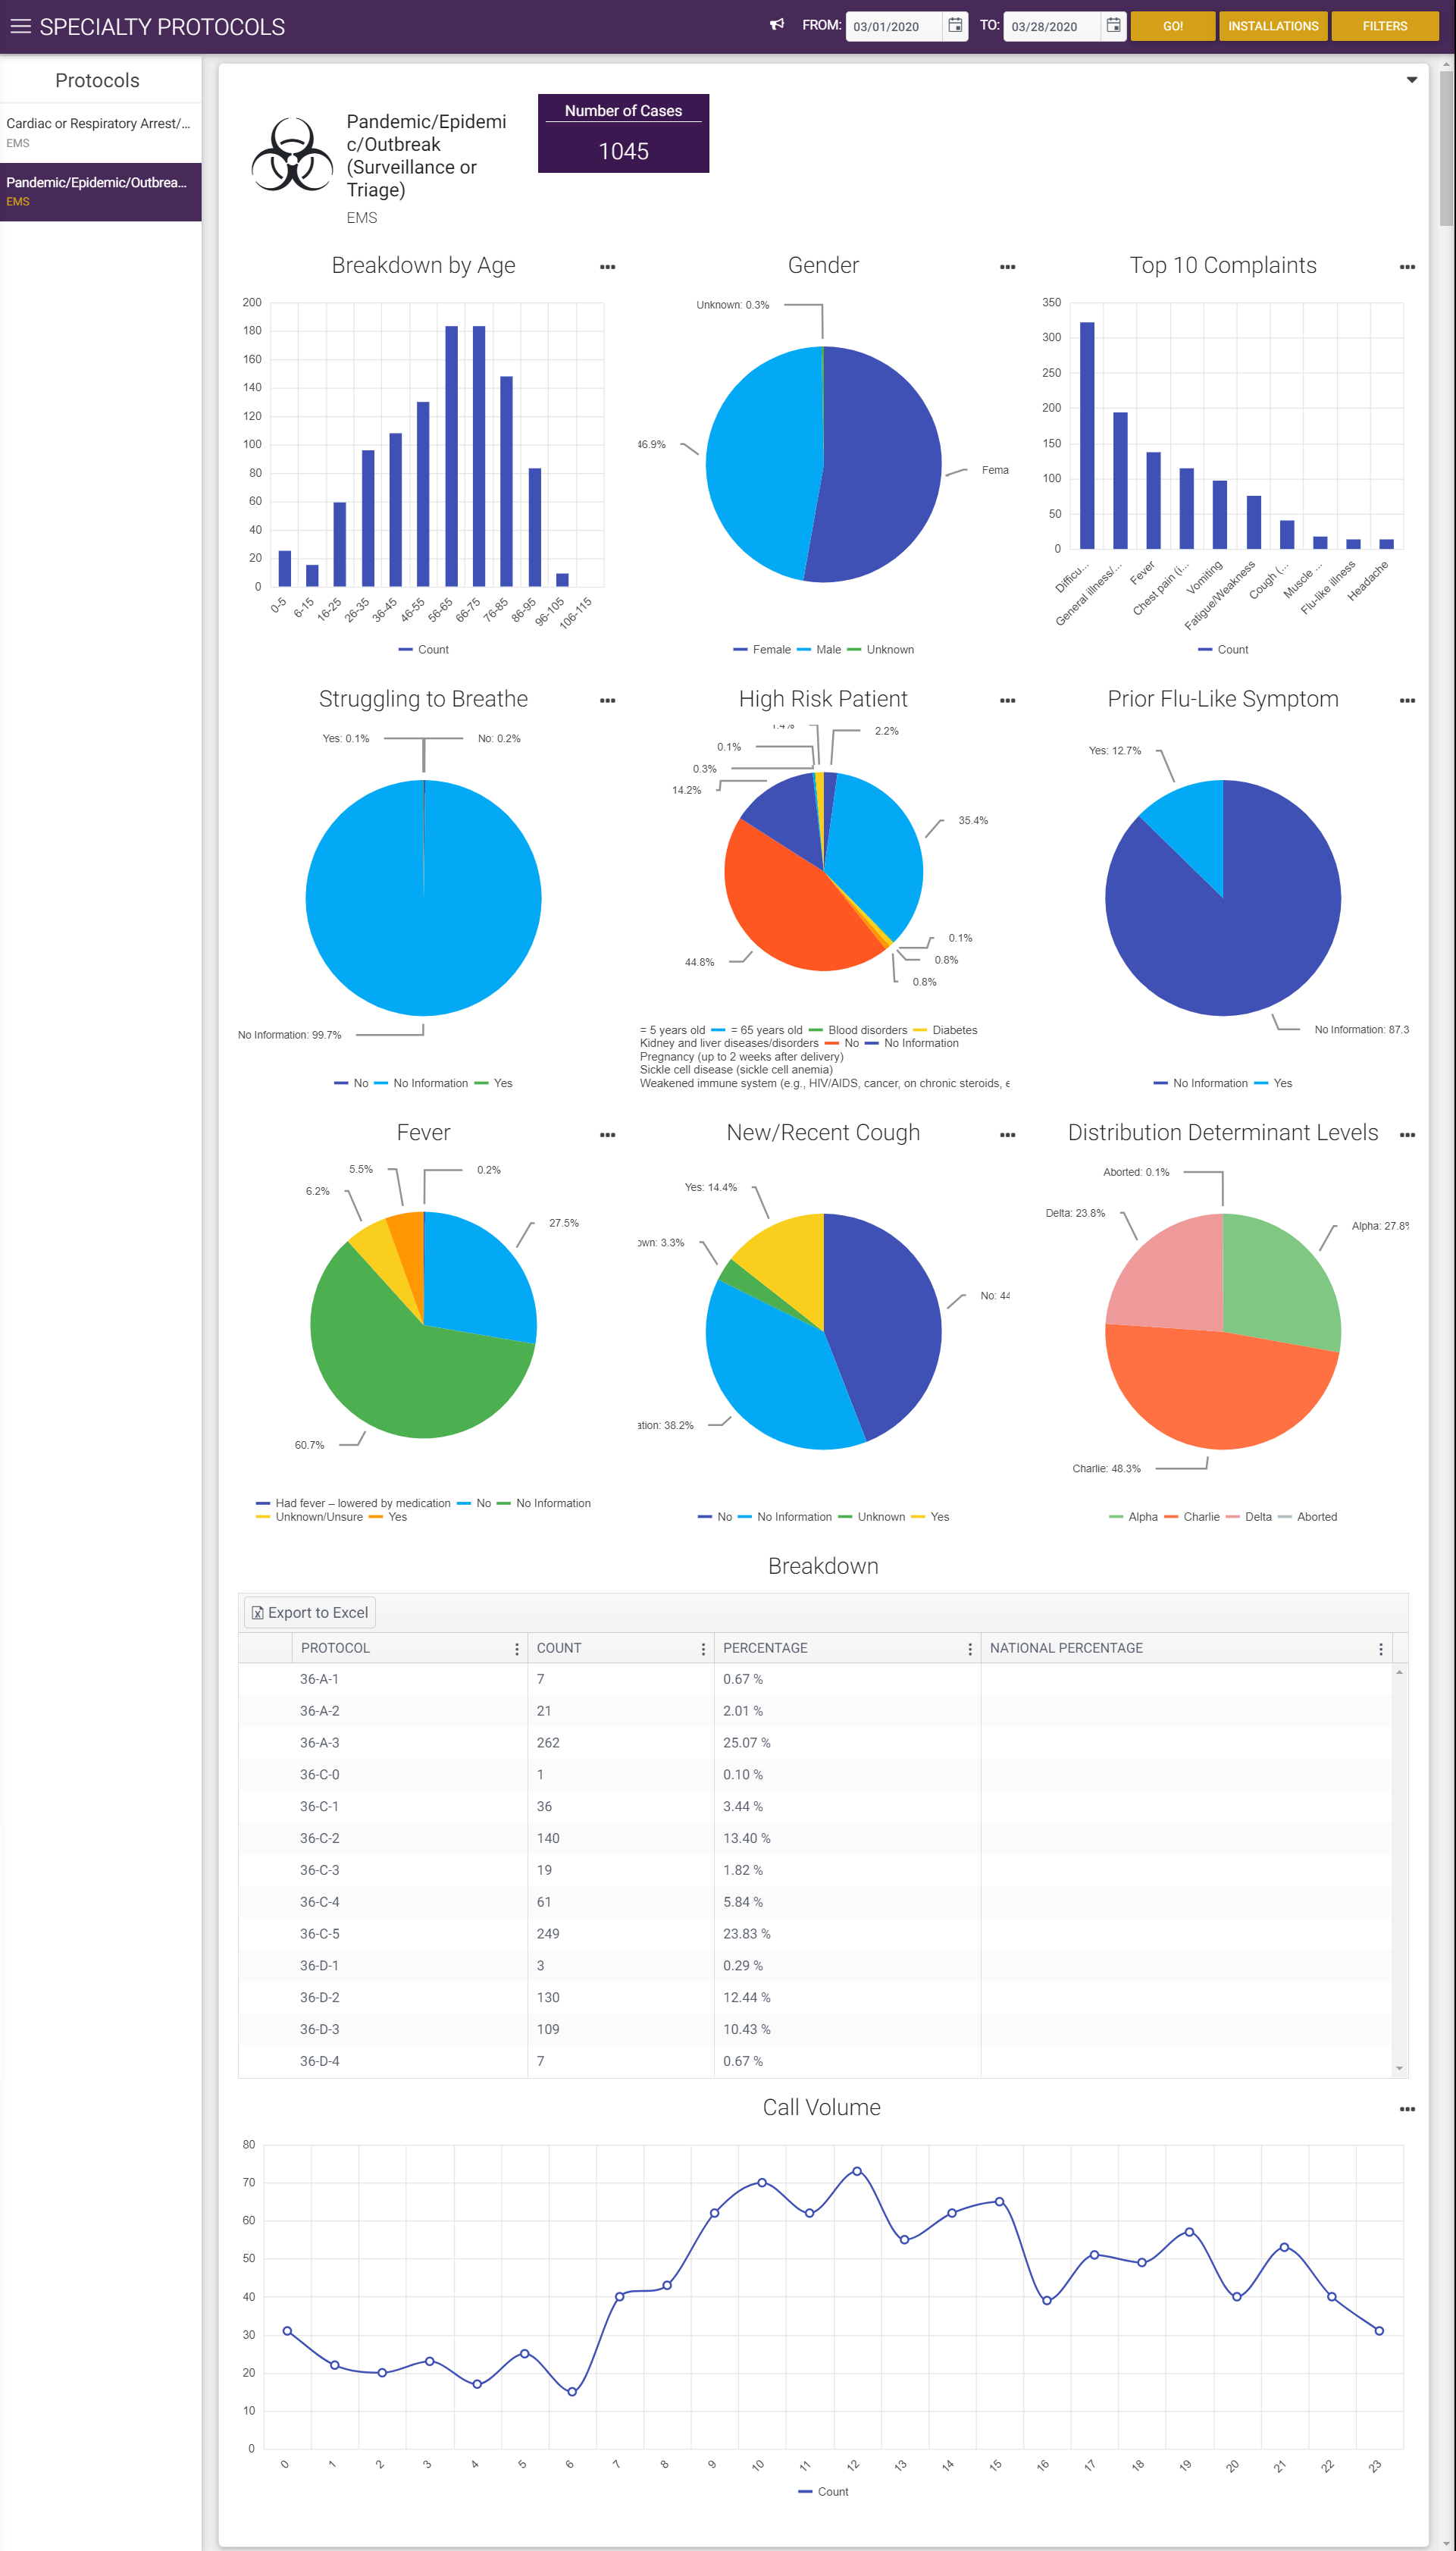
In partnership with IAED, FirstWatch has added Specialty Protocol 36 Pandemic and EIDS views into Academy Analytics.
We have added a Protocol 36 page into our Specialty Protocol section. This page currently has 12 widgets, each displaying different information, and is available by clicking on the Specialty Protocols menu item in the purple left navigation panel, then clicking on the “Pandemic/Epidemic/Outbreak menu item in the white Protocol panel.
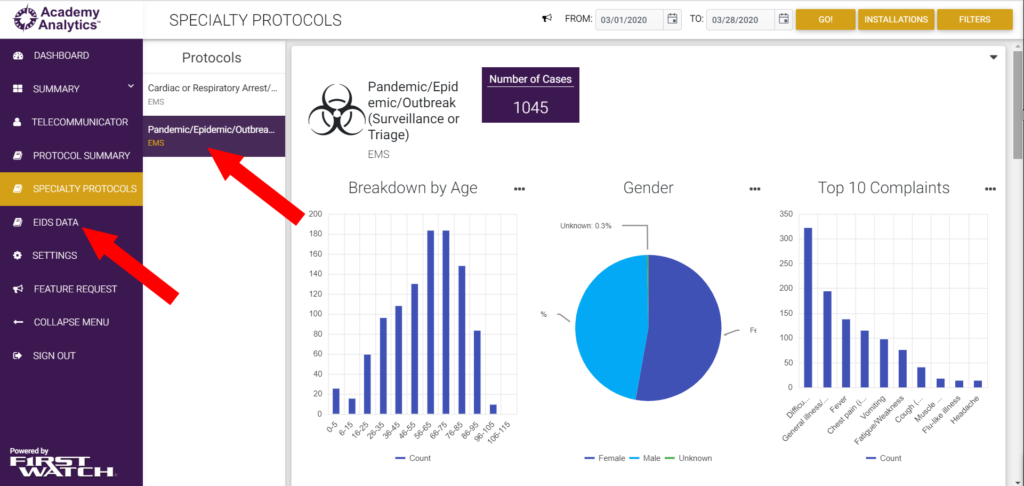
The screenshot below shows the current view of the Protocol 36 widgets. (Note, in the screenshot, the purple left navigation menu has been hidden, using the Collapse Menu item, to allow more room for the widgets.)

The Academy Analytics/ProQA Dashboard has NEW Specialty Protocol 36 and EIDS views; which offers automated ProQA data visualizations, available in either real-time, or a for a specified date range. To learn more about the new emerging infections diseases (EIDS) and Protocol 36 tools within Academy Analytics, please visit firstwatch.net/aa-new-features. For more information on FirstWatch, as well as our new PowerBI COVID-19 dashboard and other tools, please email sales@firstwatch.net or call 760-943-9123.

How FirstWatch is helping during COVID-19. Click on image for the pdf version.
FirstWatch Health Intelligence Page
To view the entries in the COVID-19 section specifically, click here.
To view all the categories including Keeping Your Employees Safe and Flu updates, or sign up for notifications, click here.
COVID-19 Related Webinars
Click here for our webinars page with upcoming events and past recordings.
Check out Mike Taigman’s new book
Click here to read Todd’s recommendation, or click the book below to go straight to Mike’s website.
